In the 1960's, Dr. Kenneth Cooper performed extensive research on the health and fitness benefits of sports and recreational exercise. His research was published in the book Aerobics, which was a popular success and helped spawn the exercise and fitness craze in America.
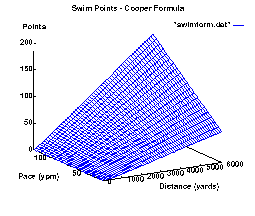
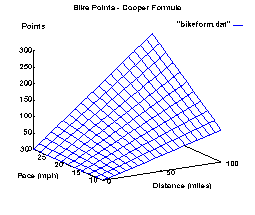
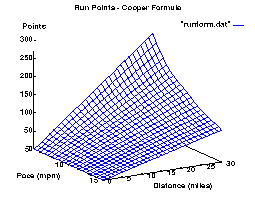
The following charts show Ken Cooper's measurements of the energy expenditure of swimming, biking, and running based on pace and distance. The z axis, points, is an arbitrary scale, allowing comparison between the sports. Thus, a 30 point effort in any sport, regardless of pace or distance, is a similar athletic effort based on energy expenditure.
For example, "30 points" of exercise can be achieved by bicycling 15 miles at 20 miles per hour, or 25 miles at 15 miles per hour. A similar effort is expended by running 5 miles at 7:30 pace or by swimming 2000 yards at a 50 yard per minute pace.
These charts show my quadratic multi-dimensional best fit of Cooper's data. The original data is available also.
Click on the image to get a larger view.


