In Numerical Methods, Spring '94, we looked at numbers - lots of them. The professor wrote lots of numbers on the board in the class room. We squinted hard to see his tiny numbers. We wrote numbers down in our notebooks on numbered pages. We swapped diskettes full of numbers. We sent each other numbers over the Internet. We read them in, and we printed them out. We complained about each others numbers.
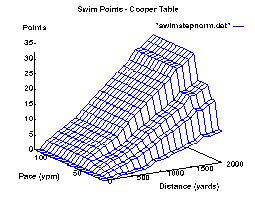
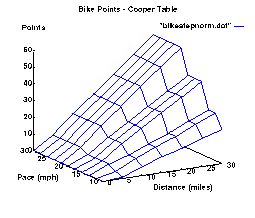
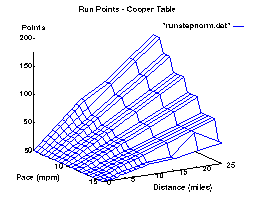
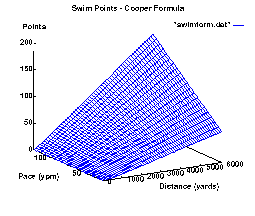
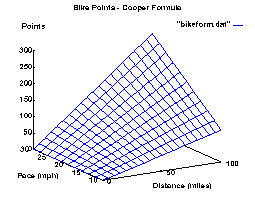
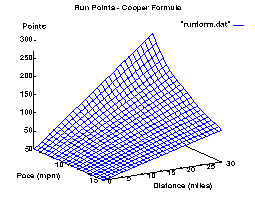
The two sets of charts represent two sets of data comparing effort expended in swimming, biking, and running, based on pace and distance. The top row of charts is empirical data on the three sports collected by Dr. Kenneth Cooper, author and founder of the Aerobics movement. The data is not smooth and does not extend to longer distances. The bottom row of charts is a two dimensional quadratic least squares fit to the data. The curve I found is smooth and extends to the paces and distances I usually run.
For more triathlon-related shenanegins, see Dan's triathlon page.